Motivation
Markdown is a markup language that has gained immense popularity in recent years. Besides being used as a convenient way to create content that generates full-blown static websites (via engines such as Gatsby.js and MarkBind), I also started to see widespread usage of Markdown in knowledge management systems such as Obsidian and Dendron.
I write articles like this one using Markdown and I am also actively exploring the use of Markdown in the above-mentioned capacities this year. As a result, I decided to dive deep into how Markdown works and hence this article.
I realized that there are two extremes in software projects:
- the most popular/battle-tested/enterprise-grade projects that define the "standard" for a particular domain
- tutorial examples/toy projects for educational purposes
While the former is complex and production ready, the latter is simple and easy to understand. The problem is that there's a huge gap between creating something simple to something complex. Should you want to do it, there's less help and at times you are basically on your own to read the code and figure out how the complex implementation works. Nonetheless, there are values in the toy examples, which is what (and why) I will be going through in this article. A simple, starter-friendly implementation.
To understand how Markdown works, I intend to implement several Markdown parsers according to the tutorials/articles that I can find online and work from simple/naive implementations to (hopefully) a more realistic implementation that can be used in production. This is the first one in the "series" and hence the elaborated introduction.
What is Markdown
As Markdown was born without a well-defined set of rules or tests, it has evolved to have a few different flavors.
The most well-known flavor of Markdown is CommonMark, which provides a standard set of rules for the language. Borrowing their Markdown reference as seen here, a common set of Markdown syntax looks like this:
*This text will be italic*
**This text will be bold**
# heading 1
## heading 2
* List
* List
* List
1. One
2. Two
3. Three
---
[link](https://www.google.com)

> and more!
The syntax available in Markdown allows you to style plain text using simple "decorators" such as * and #. It is easy to write and even reads well without the need for a rendered HTML preview.
How it works
The simplest idea for a working Markdown parser is probably using regular expressions. They help you match patterns in a string and you can thereafter replace them with the formatted version. For example, you can grab text surrounded by ** (e.g. **text**) and replace them with <b>text<b>. With this mechanism, we can establish a set of regular expressions and their string replacement strategy, and then just iteratively apply them to the input text. However, it is important to note that this approach has obvious limitations which will be discussed later.
With that, we will examine how a simple Markdown parser can be implemented.
(Note that the following sections will be brief in certain areas that are trivial. You can check the codebase for reference)
Setup
As the title suggests, we will be building our parser using TypeScript. Here are the steps to get started:
- Create a new project with
npm init -y
- Install the dev dependencies with
npm i -D typescript parcel jest ts-jest @types/jest
typescript is the TypeScript compilerparcel is a bundler that we will use to bundle our code into a single HTML filejest and the related packages are going to help during unit testing
- Initialize the TypeScript project with
npx tsc --init
- Ensure that the
tsconfig.json file generated is configured properly
With the setup done, we can start building just a few simple components.
Pattern
The Pattern class in src/Pattern.ts is an abstraction that holds the regular expression and the string replacement strategy. It also provides the method to apply the regular expression.
export class Pattern {
  regex: RegExp;
  replacement: string;
  constructor(regex: RegExp, replacement: string) {
    this.regex = regex;
    this.replacement = replacement;
  }

  apply(raw: string): string {
    return raw.replace(this.regex, this.replacement);
  }
}
As an aside, the above can be simplified by using the public modifier.
export class Pattern {
  constructor(public regex: RegExp, public replacement: string) {}

  apply(raw: string): string {
    return raw.replace(this.regex, this.replacement);
  }
}
Rule
From patterns, we create a higher-level abstraction which is the Rule. It is a collection of patterns that are applied in a sequence. The reason why we have a collection of patterns is that in Markdown, there can be more than one way to achieve the same formatting. For example, you can use * or _ to achieve italic text. The Rule class in src/Rule.ts is defined as follows:
import { Pattern } from './Pattern';

export class Rule {
  name: string;
  patterns: Pattern[];
  constructor(name: string, patterns: Pattern[]) {
    this.name = name;
    this.patterns = patterns;
  }

  apply(raw: string): string {
    return this.patterns.reduce(
      (result, pattern) => pattern.apply(result),
      raw
    );
  }
}
RMark
With Pattern and Rule, we can now use them to create a RMark class that will be the Markdown parser. RMark is just a convenient name for "Regex Markdown" and it is defined in src/index.ts as follows:
import { Rule } from './Rule';
import { Pattern } from './Pattern';

const defaultRules: Rule[] = [
  new Rule('header', [
    new Pattern(/^#{6}\s?([^\n]+)/gm, '<h6>$1</h6>'),
    new Pattern(/^#{5}\s?([^\n]+)/gm, '<h5>$1</h5>'),
    new Pattern(/^#{4}\s?([^\n]+)/gm, '<h4>$1</h4>'),
    new Pattern(/^#{3}\s?([^\n]+)/gm, '<h3>$1</h3>'),
    new Pattern(/^#{2}\s?([^\n]+)/gm, '<h2>$1</h2>'),
    new Pattern(/^#{1}\s?([^\n]+)/gm, '<h1>$1</h1>'),
  ]),
  new Rule('bold', [
    new Pattern(/\*\*\s?([^\n]+)\*\*/g, '<b>$1</b>'),
    new Pattern(/\_\_\s?([^\n]+)\_\_/g, '<b>$1</b>'),
  ]),
  new Rule('italic', [
    new Pattern(/\*\s?([^\n]+)\*/g, '<i>$1</i>'),
    new Pattern(/\_\s?([^\n]+)\_/g, '<i>$1</i>'),
  ]),
  new Rule('image', [
    new Pattern(/\!\[([^\]]+)\]\((\S+)\)/g, '<img src="$2" alt="$1" />'),
  ]),
  new Rule('link', [
    new Pattern(
      /\[([^\n]+)\]\(([^\n]+)\)/g,
      '<a href="$2" target="_blank" rel="noopener">$1</a>'
    ),
  ]),
  new Rule('paragraph', [
    new Pattern(/([^\n]+\n?)/g, '\n<p>$1</p>\n'),
  ]),
];

export class RMark {
  private rules: Rule[] = defaultRules;

  public addRuleBefore(rule: Rule, before: string): RMark {
    const index = this.rules.findIndex((r) => r.name === before);
    if (index !== -1) {
      this.rules.splice(index, 0, rule);
    }
    return this;
  }

  public addRule(rule: Rule): RMark {
    this.addRuleBefore(rule, 'paragraph');
    return this;
  }

  public render(raw: string) {
    let result = raw;
    this.rules.forEach((rule) => {
      result = rule.apply(result);
    });
    return result;
  }
}
There are two parts in src/index.ts, one being the default rules and the other being the RMark class. The default rules are the Markdown syntax that we support. As for the RMark class, its render method simply iterates through the rules and applies them to the input text. It also has the addRuleBefore and addRule methods that allow us to add new rules to the parser.
Result
Now, the parser is ready to be called via new RMark().render('input text').
A set of unit tests have been written to showcase the result:
  test('should render bold', () => {
    expect(new RMark().render('**Bold**')).toBe('\n<p><b>Bold</b></p>\n');
    expect(new RMark().render('__Bold__')).toBe('\n<p><b>Bold</b></p>\n');
    expect(new RMark().render('This is **Bold**')).toBe(
      '\n<p>This is <b>Bold</b></p>\n'
    );
  });
By using parcel, a simple HTML example is created to see the rendered result in the browser (by running npm run build and npm run serve in the rmark repository):
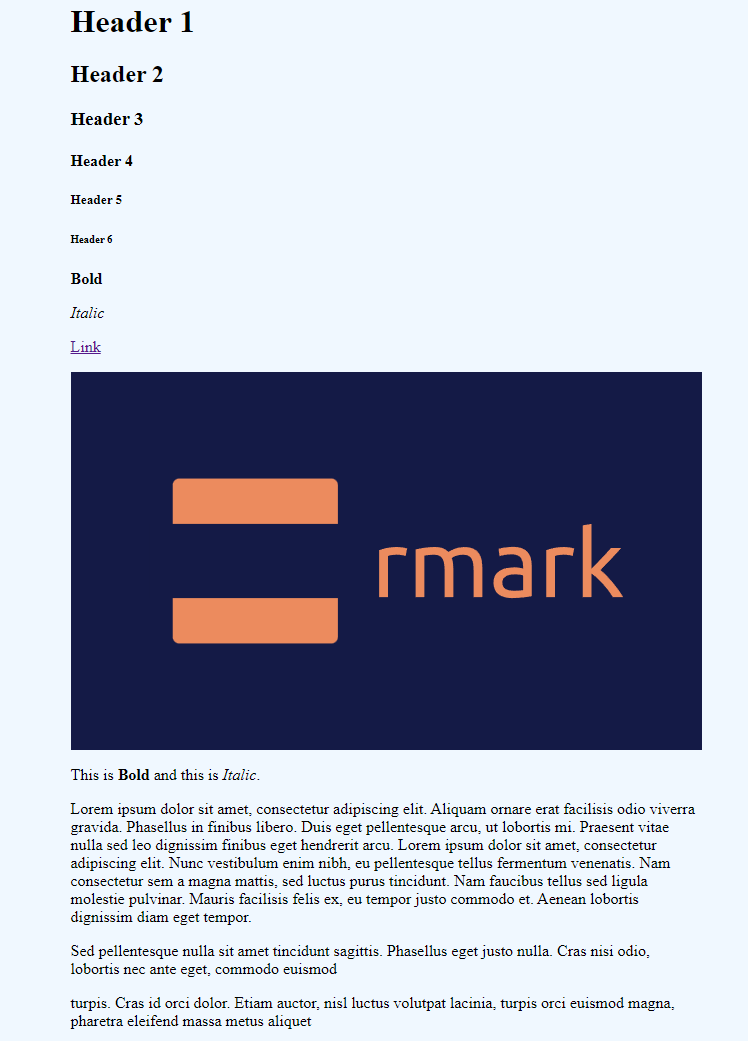
The source code below for the screenshot above can be found in src/page.ts (index.html is also created for this example to work).
import { RMark } from '.';
const sampleText = `# Header 1
## Header 2
### Header 3
#### Header 4
##### Header 5
###### Header 6
**Bold**
*Italic*
[Link](https://github.com/tlylt/rmark)

This is **Bold** and this is *Italic*.
Lorem ipsum dolor sit amet, consectetur adipiscing elit. Aliquam ornare erat facilisis odio viverra gravida. Phasellus in finibus libero. Duis eget pellentesque arcu, ut lobortis mi. Praesent vitae nulla sed leo dignissim finibus eget hendrerit arcu. Lorem ipsum dolor sit amet, consectetur adipiscing elit. Nunc vestibulum enim nibh, eu pellentesque tellus fermentum venenatis. Nam consectetur sem a magna mattis, sed luctus purus tincidunt. Nam faucibus tellus sed ligula molestie pulvinar. Mauris facilisis felis ex, eu tempor justo commodo et. Aenean lobortis dignissim diam eget tempor.
Sed pellentesque nulla sit amet tincidunt sagittis. Phasellus eget justo nulla. Cras nisi odio, lobortis nec ante eget, commodo euismod
turpis. Cras id orci dolor. Etiam auctor, nisl luctus volutpat lacinia, turpis orci euismod magna, pharetra eleifend massa metus aliquet
`;
const page = document.getElementById('page');
if (page) {
page.innerHTML = new RMark().render(sampleText);
}
Limitations
Besides offering only an incomplete set of Markdown features, there are other limitations to the simple rmark parser above.
- The regular expression approach may not be the most efficient way to parse the text
- The regular expression is difficult to write and understand for complex syntax
- The current approach does not strictly obey the CommonMark spec in terms of the expected HTML output
The limitations are frustrating because while the HTML generated looks almost there/mostly identical, it is not the same as the one generated by the referenced implementation. You can compare the difference with this markdown-it playground (Click on source in the right pane to view the HTML code as well).
One reason is that in the above simple implementation, the paragraph tags are added even for those that do not need them. For example, the heading tags should not be wrapped. However, to tweak the implementation to be more compliant with the CommonMark spec, the regular expression turned out to be difficult to create. If it stops adding the extra paragraph tags, it starts breaking other specs, such as not adding paragraphs for the block of lines. Additionally, the parser is likely to fail when handling nested Markdown syntax.
Conclusion
And...this is where most tutorials on (regex-based) Markdown parsers end! We are left with a simple parser that can handle a few Markdown features. Hopefully, this time it is going to be different. I am interested to find out how the edge cases can be handled, and how the parser can be made more efficient. So, I will stop here for now but continue with a more advanced implementation in the next post of the series.
References